Last updated October 9, 2026
The South Florida Housing Cycle
Refreshed daily from public data. Data through July 2026 (Case-Shiller) and August 2026 (Zillow).
Key takeaways
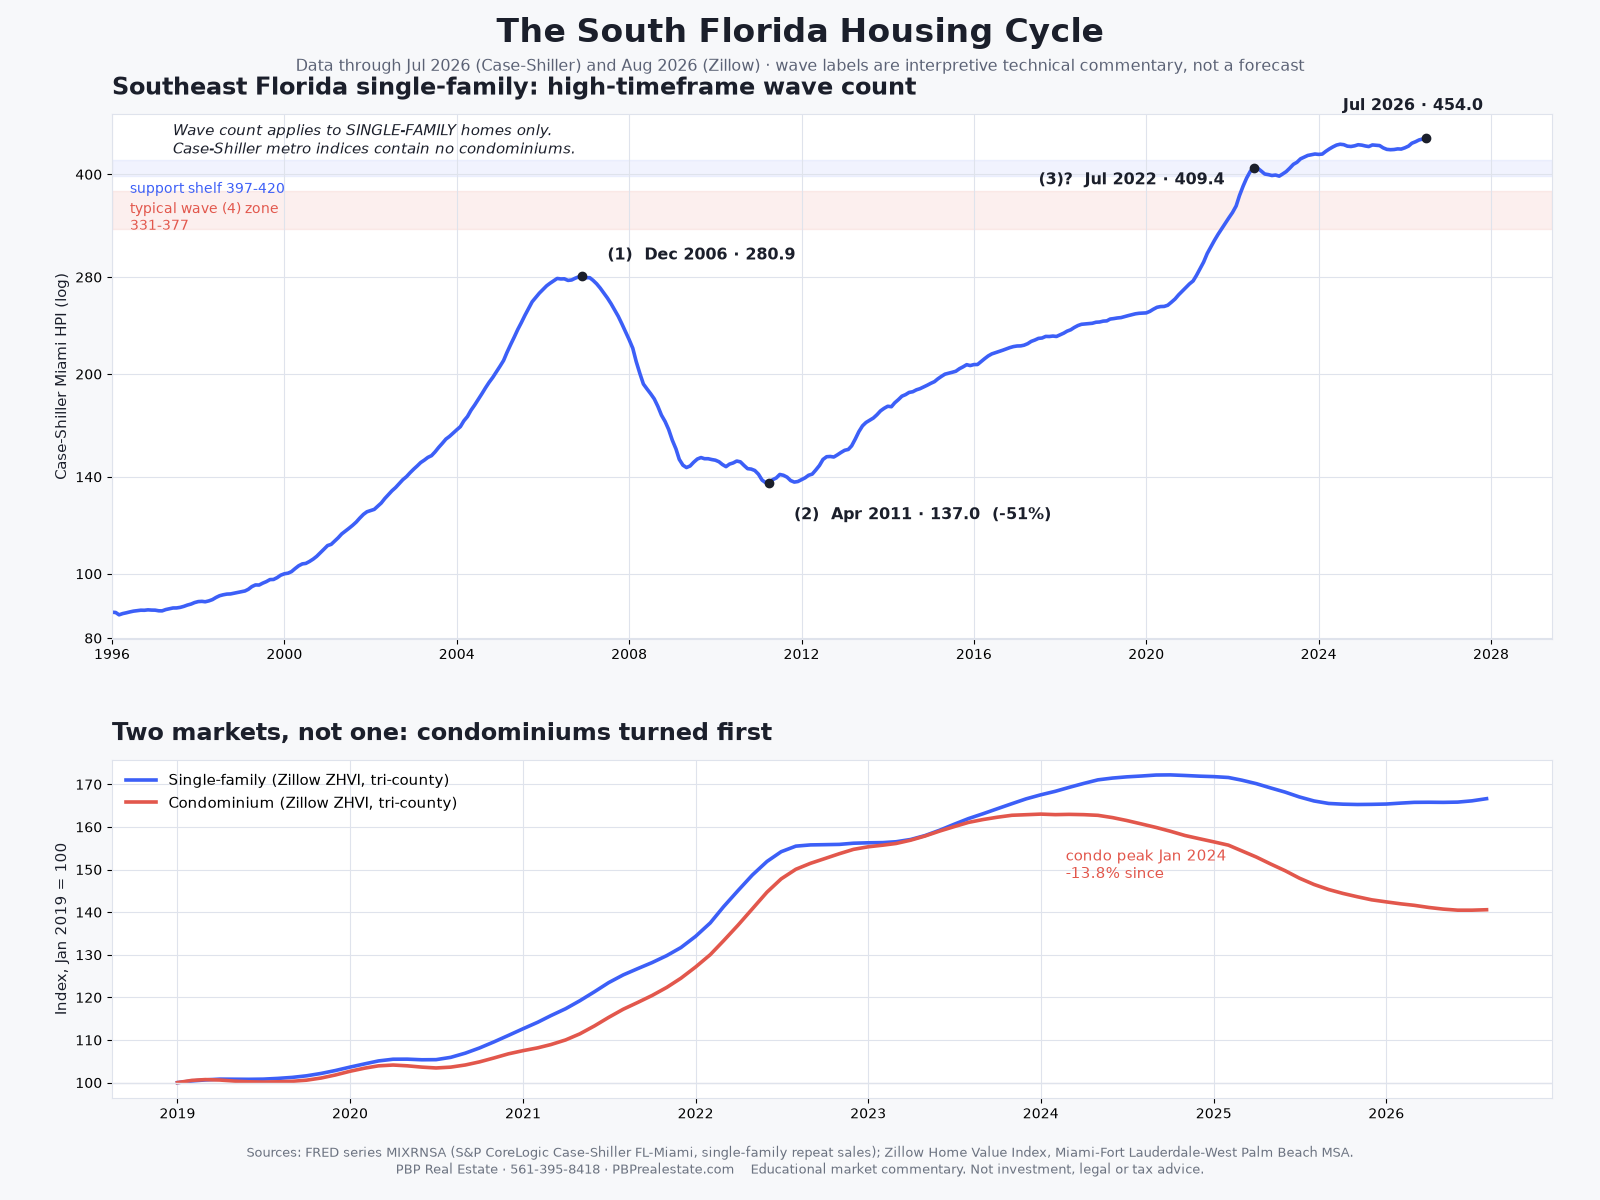
- Single-family values sit within a few percent of their all-time high, while condominiums peaked in January 2024 and have given back 13.8%.
- Tri-county single-family values are $568,611, +0.3% year over year and −3.2% from their Oct 2024 peak - essentially flat.
- The condominium market is a different story: $268,452, −4.0% year over year and −13.8% from its Jan 2024 peak.
- Since March 2020 the Case-Shiller Miami single-family index is up 78.8% against 54.0% for the U.S. national index (seasonally adjusted, through July 2026).
- Today most South Florida owners hold a fixed-rate mortgage well below current rates plus substantial equity, so they are not forced sellers.
South Florida is not one housing market right now. Single-family values sit within a few percent of their all-time high, while condominiums peaked in January 2024 and have given back 13.8%. Any headline quoting a single “South Florida price” figure is averaging two markets moving in opposite directions. This page separates them, shows the long cycle, and names the levels that decide what happens next.
Where the numbers actually are
| Measure | Latest | Vs. year ago | From its own peak |
|---|---|---|---|
| Single-family, tri-county (Zillow ZHVI) | $568,611 | +0.3% | −3.2% (peak Oct 2024) |
| Condominium, tri-county (Zillow ZHVI) | $268,452 | −4.0% | −13.8% (peak Jan 2024) |
| Case-Shiller Miami single-family index | 454.0 (July 2026) | +3.5% | at record |
| Case-Shiller Miami vs. U.S. national index, change since March 2020 (seasonally adjusted) | +78.8% vs. +54.0% | +3.5% vs. +1.9% | both at record |
Single-family and condominium figures are never combined on this page. Different products, different buyers, and at the moment different directions.
Reading the long cycle
The upper panel of the chart is thirty years of tri-county single-family prices on a logarithmic scale with a high-timeframe Elliott Wave count applied. Three moves define it: the 1996–2006 advance (+223%), the 2006–2011 decline (−51%), and the 2011–present recovery (+229%). Whether that third move ended in July 2022 or is still finishing is the open question, and it is a question about character rather than price alone. Since its July 2022 high the index has gained roughly 11% in four years, less than the 13% rise in consumer prices over the same period, on thinning volume. Prices are at highs; momentum is not.
Elliott's rule of alternation holds that when one correction is sharp and deep, the next tends to be shallow and long. The 2006–2011 decline was as sharp as they come. That argues the next correction is paid in time rather than price: a multi-year range with rallies inside it, not a repeat of 2008.
The levels worth watching
- 397–420 on the single-family index — the 2022–23 shelf, the first real floor.
- 331–377 — the deeper zone a typical fourth-wave correction reaches.
- 280 — the 2006 peak. A break below it would mean this framework is wrong and something larger is under way. Nothing in the current data points there.
Technical commentary applied to public price data. Not a forecast, and not investment, legal or tax advice.
Why condominiums turned first
The condominium decline is not mainly a price cycle. Structural inspection and reserve funding requirements landed on older buildings as special assessments, and Florida insurance costs compounded on top. That raises the cost of owning a unit without changing the unit, and buyers price it in immediately. Newer buildings and well-reserved associations have held value far better than the average; the tri-county condominium figure above spans a very wide range. If you own in an older coastal building, your reserve study matters more to your sale price than anything on this chart.
What could change the picture
- Mortgage rates. 7.50% on October 8, 2026 (Mortgage News Daily 30-year fixed index). A move toward 5.5% would free locked-in sellers, adding supply as well as demand — which can lengthen a sideways market rather than end it.
- The spread, not just the yield. Thirty-year mortgages price off the 10-year Treasury plus a spread that remains historically wide. Normalization there is a plausible source of relief even if Treasury yields do not fall.
- Inflation. Flat nominal prices during 3% inflation are a real decline of roughly 15–20% over six years. That is how a quiet market still costs a seller real money.
- Insurance and migration. The two genuine wildcards. Premiums are the structural cost that lowers what any buyer can pay; in-migration is the structural bid that has held a floor under this market for a decade.
What this means if you are thinking about selling
- Waiting is a decision with a price. If the correction is paid in time, a seller waiting for the old peak may wait years while inflation erodes the proceeds.
- Your product type matters more than the market. A well-kept single-family home and a 1970s coastal condominium are in different cycles right now.
- Pricing to the first thirty days matters more than in any market since 2011. Days on market is where pressure shows up first, long before price indices move.
Frequently asked questions
Is the South Florida housing market crashing?
No. Tri-county single-family values are $568,611, +0.3% year over year and −3.2% from their Oct 2024 peak - essentially flat. The condominium market is a different story: $268,452, −4.0% year over year and −13.8% from its Jan 2024 peak. Averaging the two produces a number that describes neither.
Why are South Florida condo prices falling while houses are not?
The condominium decline is driven by cost of ownership rather than demand for housing. Post-Surfside structural inspection and reserve funding requirements landed on older buildings as special assessments, and Florida insurance premiums compounded on top. Buyers price those carrying costs in immediately. Newer and well-reserved associations have held value far better than the tri-county average.
Will South Florida home prices drop like 2008?
The conditions are materially different. The 2006 peak was built on undocumented income, minimal down payments and adjustable rates that reset. Today most South Florida owners hold a fixed-rate mortgage well below current rates plus substantial equity, so they are not forced sellers. That is why current pressure appears as longer days on market rather than falling prices. The exception is condominiums, where assessments can force a sale regardless of the mortgage.
Should I wait to sell my South Florida home until prices go higher?
Waiting is a decision with a cost. If this correction is paid in time rather than price - a multi-year sideways range - a seller waiting for a higher nominal number may wait years while inflation erodes the real proceeds. The right answer depends on your property type, your building if you own a condominium, and your own timeline.
What mortgage rate would change the South Florida market?
The 30-year fixed stood at 7.50% on October 8, 2026 (Mortgage News Daily). A move toward roughly 5.5% would release locked-in owners, which adds both buyers and sellers - that can lengthen a sideways market rather than end it. Watch the spread between the 30-year mortgage and the 10-year Treasury as well: it remains historically wide, so relief is possible even without lower Treasury yields.
Go deeper
- Why this correction is being paid in time, not price
- Why South Florida condo prices fell first: assessments, reserves and insurance
- Why 2026 is not 2007 for the South Florida housing market
- Home prices or mortgage rates: which one raised South Florida payments more
- The bond-market number behind your mortgage rate
- Selling an inherited Florida home in a slow market
- Insurance is quietly repricing Florida homes
- Will Distressed Supply Return to Florida in 2026 and 2027?
- Florida home prices are trailing the US. Is South Florida?
- What Comes After the Sideways Years: South Florida Housing Toward 2030
Where your own property sits
Averages do not sell houses. Request a human-prepared market analysis — single-family or condominium, priced on your building and your street rather than a metro average. No automated estimate.
Free seller guide: Selling into a Fourth Wave
Nine pages on where South Florida sits in this cycle, why houses and condominiums have separated, and what a correction paid in time rather than price costs a seller who waits. Built from public data only. Updated monthly.
Sources and method
- S&P CoreLogic Case-Shiller FL-Miami Home Price Index (FRED series MIXRNSA), January 1996 – July 2026. Single-family repeat sales; contains no condominiums.
- Zillow Home Value Index, single-family and condominium tiers, Miami–Fort Lauderdale–West Palm Beach MSA, through August 2026. National comparison: S&P Cotality Case-Shiller U.S. National Home Price Index (FRED series CSUSHPISA).
- Mortgage News Daily 30-year fixed rate index (mortgagenewsdaily.com), latest daily reading.
- Wave labels are interpretive Elliott Wave analysis applied to the source data and are not part of any index.
Published by PBP Real Estate, LLC · 561-395-8418 · PBPrealestate.com. Educational market commentary only; not investment, legal or tax advice. No multiple listing service data is used on this page.
  </section>


    <section id="listings" class="mb-14 -mx-4 sm:-mx-12 md:mx-0">


    </section>
What would yours sell for?
Every figure on this page comes from BeachesMLS, not from an automated estimate. Tell us about your property and Gia Freer, our Broker of Record, will put together a written opinion of value from the same data.
Ask what your home would sell for
764 closed transactions (Gia and Grant Freer, since 2000)5.0 from 86 Google reviewsLicensed since 1997 and 2000