Last updated September 19, 2026
Cost of Living in South Florida: Monthly Cost to Own by City
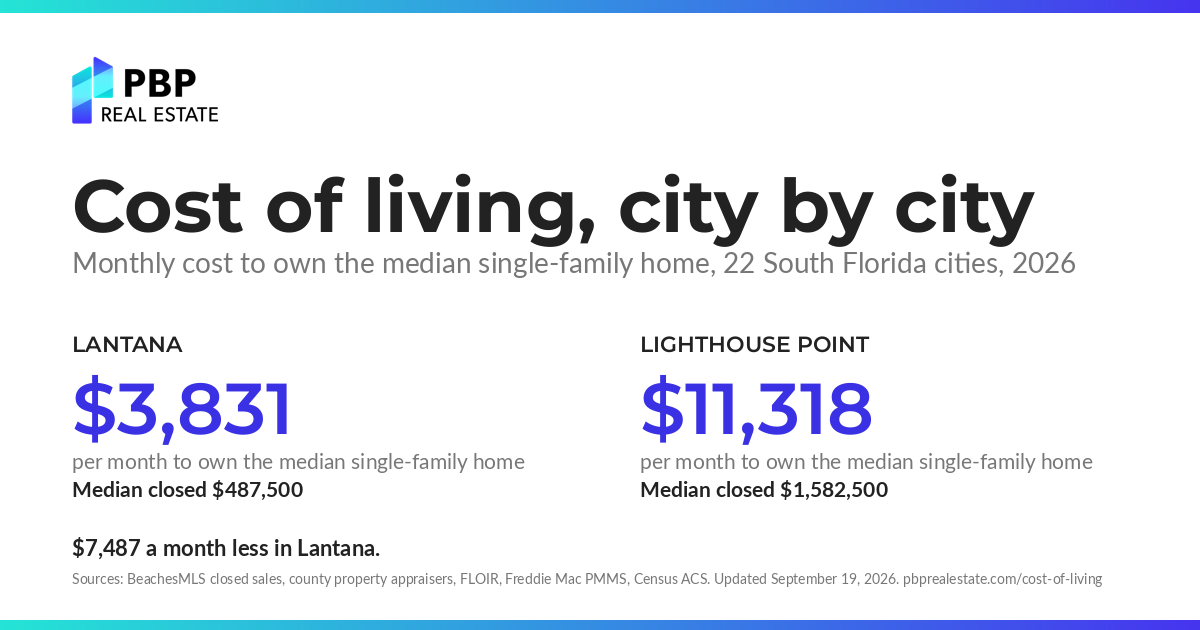
Owning the median single-family home costs from about $3,831 a month in Lantana to about $11,318 a month in Lighthouse Point across 14 Palm Beach County and 8 Broward County cities in 2026, before the cash-dominated coastal markets. Same method everywhere: median closed price, 20% down at 6.95%, homestead property tax at the 2025 millage, county-average insurance, the median association fee. Every input is cited and the pages refresh nightly.
See what your home is worth Comparing two of these cities because you are moving between them? Start with the number on the home you already own, or call (561) 395-8418.
Monthly cost to own the median house, every city
| City | County | Median house (closed, 2026 YTD) | Own, house | Median condo/townhouse | Own, condo | 2025 millage | Median HOA fee | Median condo fee |
|---|---|---|---|---|---|---|---|---|
| Lantana rent vs own | Palm Beach | $487,500 (n=60) | $3,831 | $310,000 | $2,991 | 19.4661 | too few listings | $722 |
| Greenacres rent vs own | Palm Beach | $455,000 (n=136) | $3,939 | $212,750 | $2,038 | 19.1071 | $345 | $446 |
| Lake Worth Beach rent vs own | Palm Beach | $555,000 (n=945) | $4,389 | $205,000 | $2,133 | 21.6106 | too few listings | $563 |
| Pompano Beach rent vs own | Broward | $525,000 (n=430) | $4,457 | $280,000 | $2,816 | 20.2573 | $350 | $780 |
| Deerfield Beach rent vs own | Broward | $522,000 (n=271) | $4,514 | $192,500 | $2,043 | 20.2694 | $428 | $618 |
| Boynton Beach rent vs own | Palm Beach | $528,700 (n=1,254) | $4,638 | $268,000 | $2,715 | 20.008 | $500 | $727 |
| Royal Palm Beach rent vs own | Palm Beach | $570,000 (n=260) | $4,709 | $262,000 | $2,397 | 18.1852 | $362 | $483 |
| Hollywood rent vs own | Broward | $550,000 (n=747) | $4,716 | $310,000 | $3,226 | 20.8985 | $408 | $967 |
| Westlake | Palm Beach | $620,000 (n=111) | $4,814 | $450,500 | $3,288 | 20.8652 | too few listings | too few listings |
| West Palm Beach rent vs own | Palm Beach | $575,000 (n=1,077) | $4,935 | $247,500 | $2,441 | 20.4468 | $455 | $588 |
| Coral Springs rent vs own | Broward | $700,000 (n=617) | $5,331 | $218,750 | $2,201 | 20.2856 | too few listings | $592 |
| Fort Lauderdale rent vs own | Broward | $700,000 (n=1,205) | $5,581 | $450,000 | $4,338 | 18.4464 | $350 | $1,175 |
| Wellington | Palm Beach | $757,000 (n=460) | $6,178 | $425,000 | $3,881 | 18.7352 | $525 | $839 |
| Weston rent vs own | Broward | $925,000 (n=369) | $6,822 | $395,000 | $3,424 | 16.2843 | $211 | $699 |
| Delray Beach rent vs own | Palm Beach | $899,900 (n=813) | $7,045 | $240,000 | $2,469 | 18.45 | $433 | $700 |
| Boca Raton rent vs own | Palm Beach | $1,035,000 (n=1,545) | $7,894 | $360,000 | $3,315 | 17.0029 | $477 | $764 |
| Jupiter | Palm Beach | $1,074,500 (n=746) | $8,171 | $500,000 | $4,509 | 16.9938 | $490 | $1,018 |
| Palm Beach Gardens rent vs own | Palm Beach | $1,109,000 (n=829) | $8,414 | $415,000 | $3,664 | 17.8608 | $425 | $717 |
| Parkland | Broward | $1,212,500 (n=398) | $8,728 | $560,000 | $3,912 | 18.3944 | too few listings | too few listings |
| Highland Beach | Palm Beach | $6,725,000 (n=12) | $9,354 cash basis | $975,000 | $8,323 | 15.8455 | too few listings | $1,733 |
| Lighthouse Point | Broward | $1,582,500 (n=136) | $11,318 | $163,019 | $1,800 | 18.8914 | too few listings | $594 |
| Palm Beach | Palm Beach | $12,594,762 (n=82) | $16,084 cash basis | $1,686,250 | $13,287 | 14.869 | too few listings | $2,124 |
Own, house and Own, condo are the total monthly cost at the median closed price: principal and interest, property tax with both homestead exemptions, county-average insurance and the median association fee for that city. Medians are published only where at least 10 sales closed. Cash basis means the median buyer in that market does not finance, so principal and interest are left out.
Monthly cost to own the median condo or townhouse
The median condo or townhouse costs $1,800 a month to own in Lighthouse Point and $13,287 in Palm Beach, across the 22 financed cities with at least 10 closed condo sales. The association fee is usually the largest line after the mortgage, and what it covers (insurance on the building, reserves, water, cable) differs by building, so compare fee inclusions before comparing totals.
City-by-city comparisons
Each pair page puts two cities side by side: the full cost stack, property tax on the same price, fees and what they include, rents and income, and the year owning beats renting.
Need a pair that is not here? Every city above has the same inputs, so any two can be compared on request.
See what your home is worth
Every move between these places starts with one number on the home you already own. Gia Freer prepares a written opinion of value by hand from our own BeachesMLS data, with the comparable sales attached. No automated estimate is published on this site.
See what your home is worth or call (561) 395-8418. Conversations are confidential and there is no cost to having one.
Where the money goes next
- Rent vs own: the break-even year by city
- Moving from New York: the tax and homestead guide
- HOA fees by city and condo fees by city
- Seller closing costs in Palm Beach County
- What your home is worth
See what your home is worth Two cities, every input shown. The one figure this page cannot show you is your own; that takes a conversation: (561) 395-8418.
Sources and method
Closed prices: Based on information from BeachesMLS for August 2026 and for January 1, 2026 through August 31, 2026, retrieved September 19, 2026. Information deemed reliable but not guaranteed. Medians shown only where n ≥ 10; co-ops excluded. Mortgage: Freddie Mac Primary Mortgage Market Survey, 30-year fixed 6.95%, week ending 2026-09-17, 20% down. Millage: Palm Beach County and Broward County Property Appraisers, 2025 final rates, most-parcels code per municipality. Homestead: ss. 196.031 and 193.155, F.S.; purchase price treated as year-1 just value. Insurance: Florida Office of Insurance Regulation, Property Insurance Stability Unit report, July 2026, county averages including wind. Fees: PBP HOA and condo fee indexes from active listings. All figures are estimates for comparison; verify tax with the property appraiser and insurance with a licensed agent. General information, not tax, legal or financial advice. Refreshed nightly.
Free to reuse with attribution and a link to PBP Real Estate. Figures, tables and charts on this page may be quoted, screenshotted or embedded. Keep the source line and link to www.pbprealestate.com/cost-of-living/. Aggregates only: no address, listing number or listing-level record is published here.
For sellers
Pricing a home is a skill. Start with the current competition and recent closed sales.
42.9% of active single-family houses listings in South Florida have a recorded asking price below their original list price.
The data comes from the segment and recorded fields available in PBP Real Estate's BeachesMLS feed, as of the date shown. Gia Freer, Broker of Record, turns comparable sales and current competition into one written pricing opinion for your home, with the reasoning, before it goes live.
No website estimate, no automated number: a comparative market analysis done by hand, within one business day.
Request a pricing opinion for your property
Selling? Pricing correctly is a skill. Gia Freer prices your home from this data before it goes live.
Ask Ava about this dataPrice my home correctly