As of October 12, 2026 · Miami Springs MLS City sample · Miami-Dade County comparison
Miami Springs price cuts: 30% of active houses are recorded below original asking
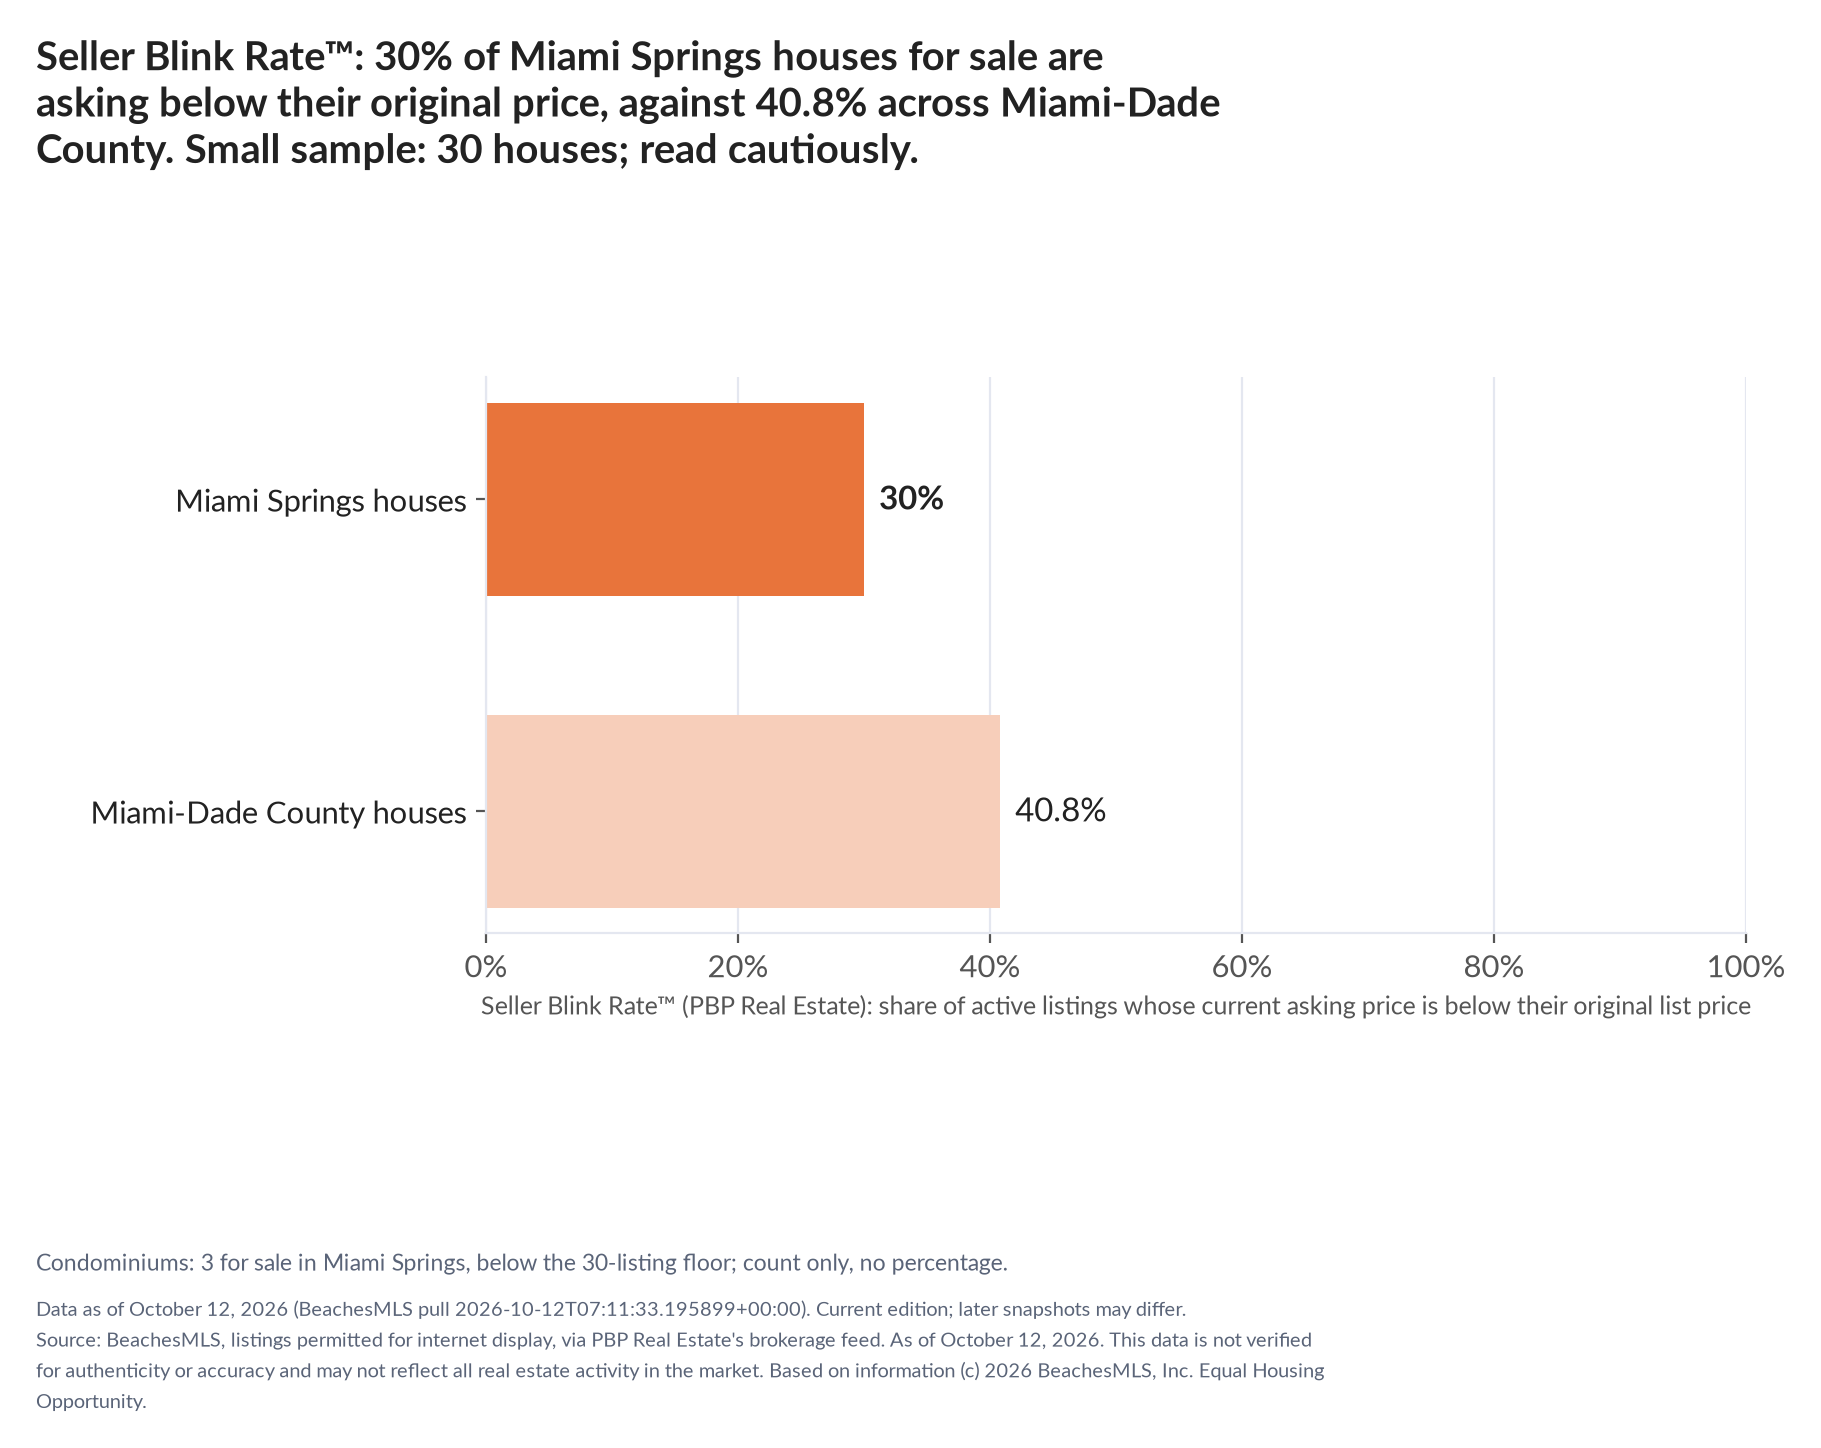
As of October 12, 2026, 9 of 30 active single-family homes in Miami Springs (30%) have a recorded asking price below the original list price.
Condominiums: 3 for sale in Miami Springs, too few to report percentages (floor 30). Small sample: Miami Springs has between 30 and 39 houses for sale, so one listing moves the share by about 3.3 points. Read the percentages as a direction, not a decimal.
Conditions todayHouses: Between the comparison thresholds (30% recorded below original versus 44.3% median across 28 peer cities; small sample: 30–39 active listings; 4 under contract, percentage not interpreted)Peer group, houses (median asking $600K to $1M: Homestead, Royal Palm Beach, Coconut Creek, Hallandale Beach, Oakland Park, Pompano Beach, Hollywood, Dania Beach, Jensen Beach, North Miami Beach, Hialeah, Pembroke Pines, Miramar, Cutler Bay, West Palm Beach, North Miami, Westlake, Stuart, The Acreage, Coral Springs, Hobe Sound, Palm City, Cooper City, Plantation, Miami, Loxahatchee, Wilton Manors).How the read works: the peer baseline is the median of published city shares in the same current median-asking-price tier, houses and condominiums separately. The lower-share label requires a below-original share at least 3 points under baseline and at least 65% of under-contract listings (minimum 10) not recorded as below original. That complement may include unchanged, raised or missing-price records; it is not a history measure. The higher-share label requires 3 or more points above baseline; other results are between the rule's thresholds. With fewer than four peer cities, the county is the baseline and can include the city. Samples of 30–39 active listings require caution. Snapshot comparison only, not speed, causality or a forecast.
Source: BeachesMLS, listings permitted for internet display, via PBP Real Estate's brokerage feed. As of Oct 12, 2026.
For buyers and sellers: 30% of active houses in Miami Springs are recorded below original asking; the reduced subgroup is too small for a median. Compare these asking prices with recent closed sales before choosing your price.
The story for media: "30% of active single-family homes in Miami Springs have a recorded asking price below original, compared with 40.8% in the separately calculated Miami-Dade County sample, which can include the city, according to PBP Real Estate analysis of BeachesMLS listing data as of October 12, 2026."
This week in Miami Springs: what moved in the last seven days
| Movement | Houses | Condominiums (too few to read) |
|---|---|---|
| Came on the market, last 7 days | 1 | 0 |
| Asking price cut, last 7 days | 2 | 0 |
| Active listings today | 30 | 3 |
Seven days ending October 12, 2026, counted from PBP's own daily snapshot of BeachesMLS listings permitted for internet display. Of the 1 listings that came on the market in the last seven days, 1 is a first-time listing and 0 returned to the market after an earlier listing, because a listing counts on the date it became active. Houses and condominiums are counted separately and never blended. Week-over-week comparison begins with the reading published on September 16, 2026, measured against the September 9, 2026 baseline. PBP's coverage of the feed widened on September 9, so any comparison reaching back past that date would measure the data, not the market. No figure here is estimated or backfilled.
For buyers
Get new listings that match, straight from our MLS feed
9 of 30 Miami Springs houses for sale are recorded below their original asking price as of October 12, 2026. Tell us what you are looking for in Miami Springs and you will hear when a match lists, cuts its price, or comes back on the market.
Tell us what you are looking for and you will hear from Gia when a listing matches it, when one of your matches cuts its price, and when one comes back on. It is read straight from the BeachesMLS feed this site is built on, not a syndicated copy of it, and the same feed produces the market pages below.
No account and no password. One click stops it. You can keep browsing every city and neighborhood on this page without giving us anything.
For sellers
Pricing a home is a skill. Start with the current competition and recent closed sales.
30% of active single-family house listings in Miami Springs have a recorded asking price below their original list price.
The data comes from the segment and recorded fields available in PBP Real Estate's BeachesMLS feed, as of the date shown. Gia Freer, Broker of Record, turns comparable sales and current competition into one written pricing opinion for your home, with the reasoning, before it goes live.
No website estimate, no automated number: a written opinion of value prepared by hand, within one business day.
Request a pricing opinion for your property
Selling? Pricing correctly is a skill. Gia Freer prices your home from this data before it goes live.
Ask Ava about this dataPrice my home correctlySeller Blink Rate™ is the share of active listings with a recorded asking price below the original list price. The denominator is all active listings in the segment. The complement may include unchanged prices, increases and missing-price records; it does not establish a price history. Of 30 active: 9 below original, 19 unchanged, 1 above original and 1 missing a usable price pair. DOM n=29; CDOM n=29. “Miami Springs” groups the MLS City field within the five counties. It can span county lines and is not a municipal-boundary verification. The county comparison is calculated separately and can include this city's listings.Active segment counts by recorded county: Miami-Dade: 30. Snapshot 2026-10-12; retrieved 2026-10-12T07:11:33.195899+00:00; aggregate generated 2026-10-12T07:11:56+00:00; source 60778 rows, SHA-256 0cf11ed97d8471c3ce32d06290b8e5a05bcba9366b43de8b97222d3f29ef5563. Statistical date, retrieval and publication are distinct.
Seller Blink Rate™ and Buyer Hesitation Time™ are trademarks of PBP Real Estate, LLC. Buyer Hesitation Time means median counted cumulative days among listings with a listing contract date; it does not measure buyer behavior or reconstruct a property history.
Asking prices and counted days help you compare the current competition. They do not establish why a property has not sold or guarantee how quickly it will sell. Houses and condominiums are calculated separately. Condominiums: 3 active; below the 30-listing floor for percentages.
Key takeaways
- 9 of 30 active single-family homes in Miami Springs (30%) have a recorded asking price below original as of October 12, 2026, versus 40.8% in the separately calculated Miami-Dade County sample.
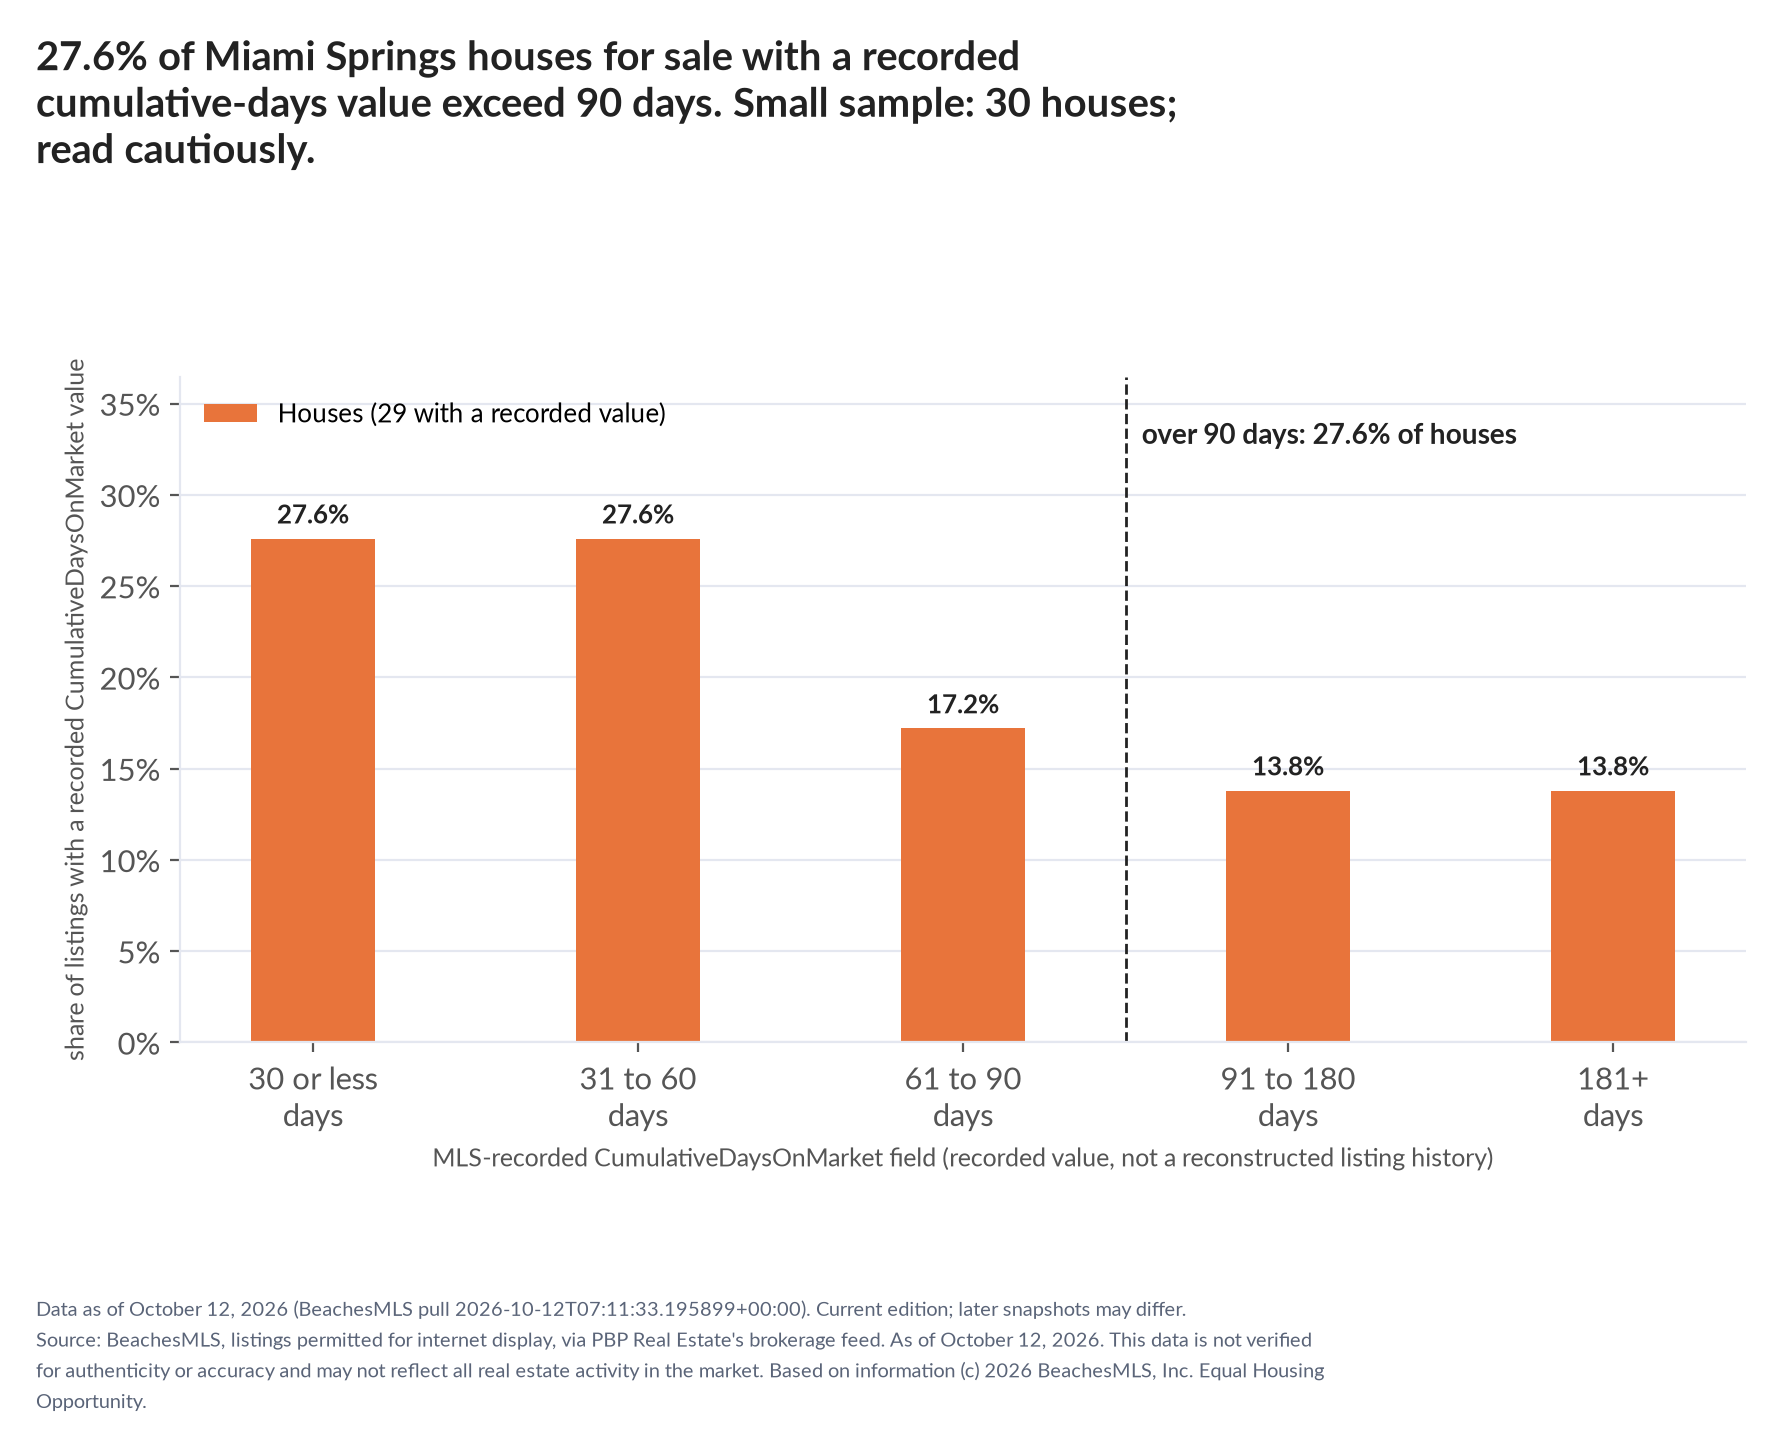
- Median counted cumulative days on market for houses with a listing contract date: 49 days; 27.6% of houses with a counted CDOM are past 90 days.
How long have Miami Springs listings in each asking-price group been on the market?
- Not below original: CDOM ≤60 or missing
- Recorded below original
- Not below original: CDOM >90
- Other: not below original, CDOM 61–90
Source: BeachesMLS, listings permitted for internet display, via PBP Real Estate's brokerage feed. As of Oct 12, 2026.
The chart partitions active listings by recorded price comparison and counted CDOM. The ≤60 group includes missing CDOM values under the calculation used for this snapshot. Not-below-original groups may contain missing prices or increases; they are not unchanged-price histories. Other is the remaining CDOM 61–90 group. These groups do not explain seller or buyer decisions.
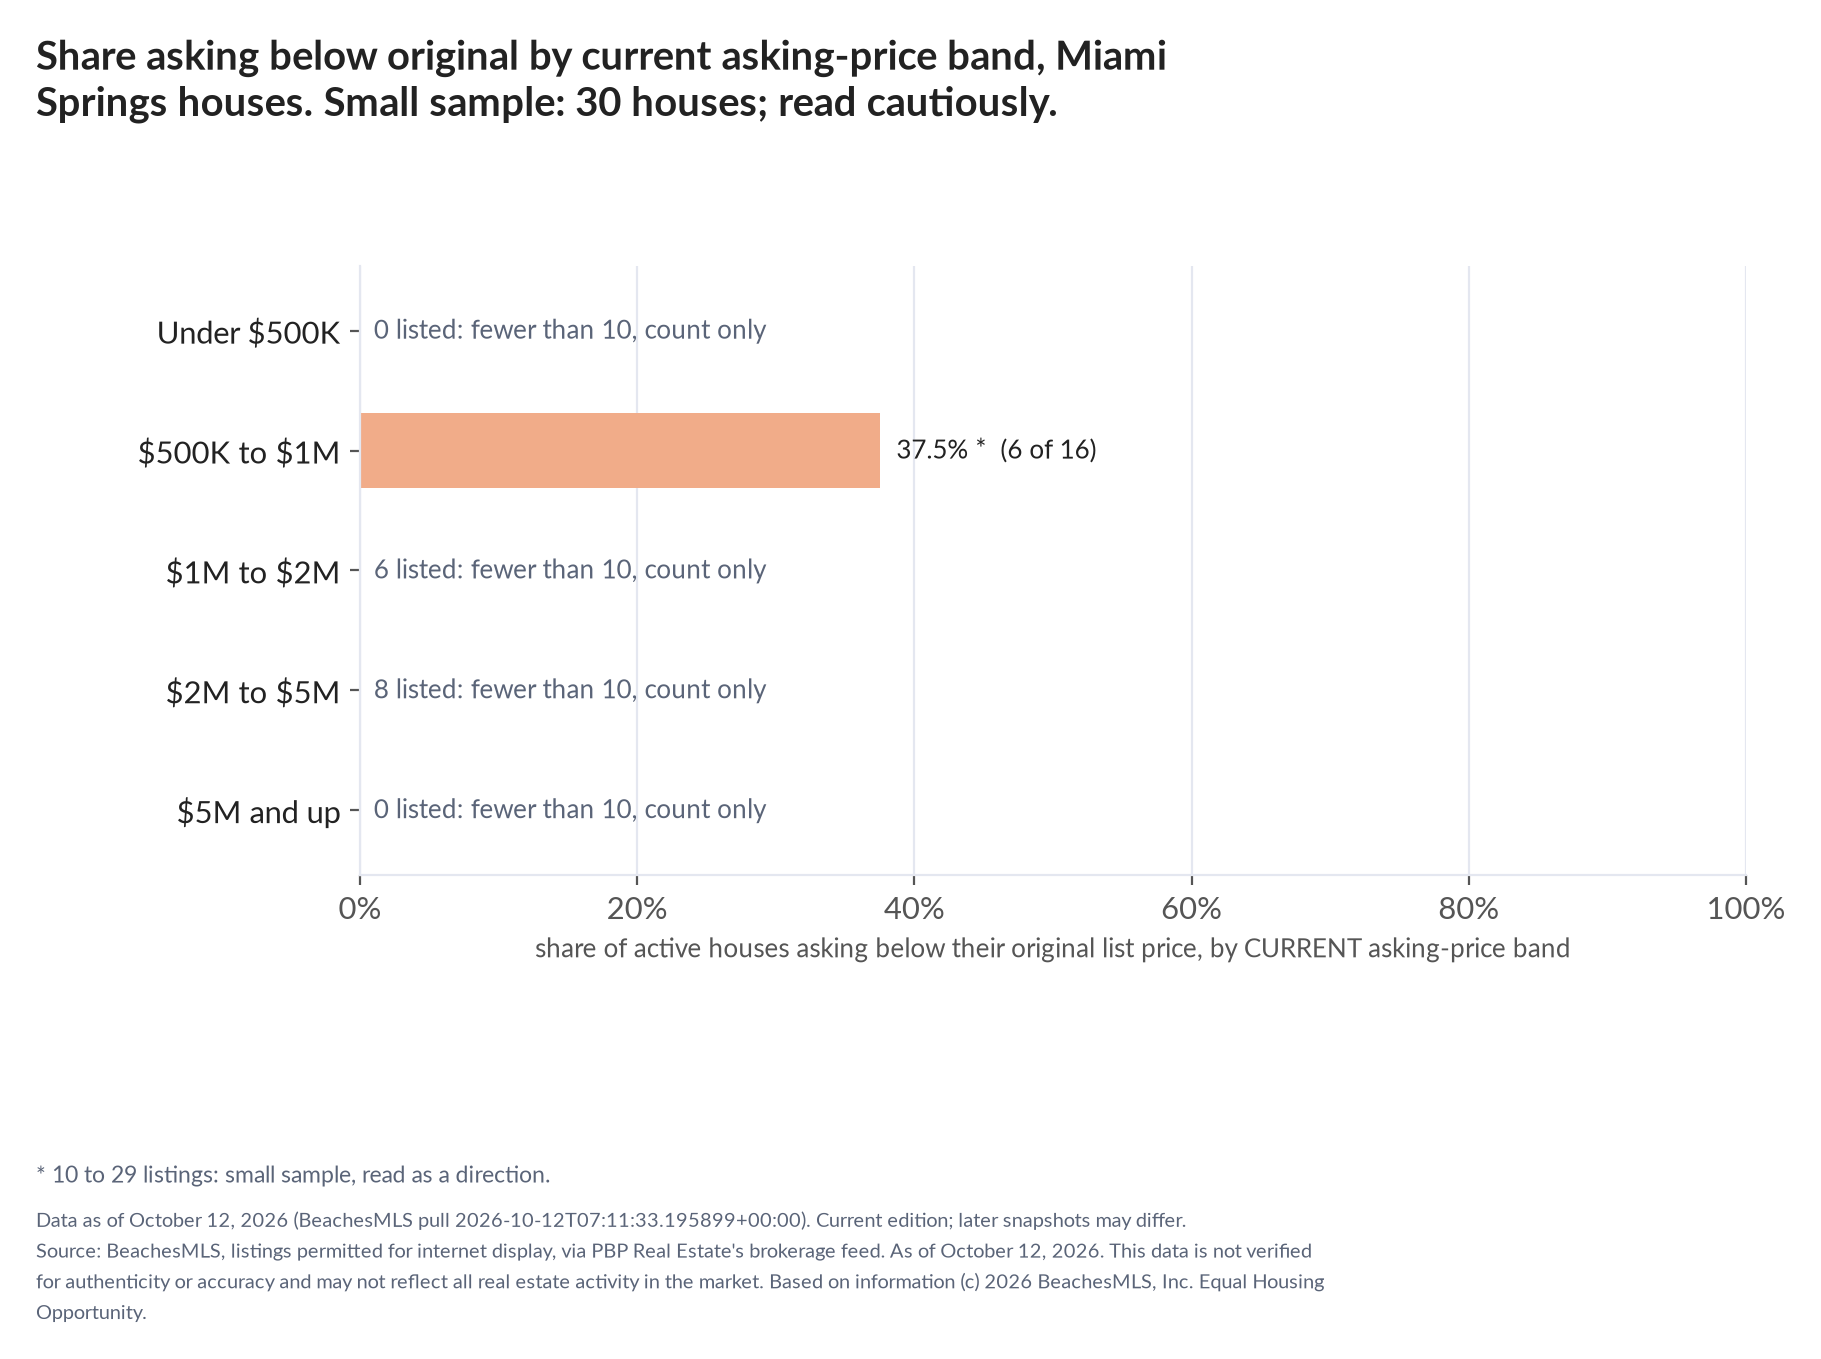
Current asking-price bands, Miami Springs houses
Source: BeachesMLS, listings permitted for internet display, via PBP Real Estate's brokerage feed. As of Oct 12, 2026. * $500K to $1M: fewer than 30 listings, read with care. Bands under 10 listings are gray and not read at all.
Longer bars mean a larger below-original share, not more reduction events or a larger dollar reduction. Days are median non-missing CDOM.
Miami Springs: counted CDOM above 90 days, 27.6% of houses, among non-missing CDOM
Source: BeachesMLS, listings permitted for internet display, via PBP Real Estate's brokerage feed. As of Oct 12, 2026.
Miami Springs houses: median days on market counted by PBP 49 days; median counted cumulative days 49 days. Days on market are counted by PBP from the listing contract date recorded in the MLS to the snapshot date. For listings the MLS records as relisted, the recorded prior time on market is added to give cumulative days. The MLS's own day counters refresh in batches and can trail the calendar by weeks, so they are not used directly. Days spent under an earlier contract that fell through are not subtracted. Each median uses listings with a usable listing contract date. These figures do not independently reconstruct property histories or establish how portals display days on market. 0% of all active houses carry recorded prior time on market, so counted CDOM exceeds DOM; that does not establish a relisting event.
| Cumulative days on market | Houses | Share |
|---|---|---|
| 30 days or less | 8 | 27.6% |
| 31 to 60 | 8 | 27.6% |
| 61 to 90 | 5 | 17.2% |
| 91 to 180 | 4 | 13.8% |
| More than 180 | 4 | 13.8% |
What did under-contract listings in Miami Springs ask compared with their original price?
Miami Springs: 4 houses listings under contract; fewer than 10 or percentage unavailable. No percentage or median is interpreted.
Under contract means Pending or Active Under Contract. Counted cumulative days are not independently measured days to contract. Asking prices do not disclose agreed contract prices.
Source: BeachesMLS, listings permitted for internet display, via PBP Real Estate's brokerage feed. As of Oct 12, 2026.
How has the Miami Springs below-original share moved since tracking began?
Source: BeachesMLS, listings permitted for internet display, via PBP Real Estate's brokerage feed. As of Oct 12, 2026.
What should a Miami Springs seller or buyer do with these numbers?
Sellers
- Compare the current competition and recent closed sales, rather than treating an unchanged asking price as proof of market value.
- If a listing has not attracted an offer, review its price, presentation, exposure and showing feedback together.
- Ask your agent to review available listing records; these aggregate fields do not reconstruct a property's history.
- Price where the home will sell, not where a cut can take it later: in September 2026 the typical Miami-Dade County house sold 4.8% under its original asking price (2.7% under the final), and the 40% of sellers who had cut before a contract waited a median 93 days from listing to contract against 19 for those who never cut. Sale price versus original asking price, Miami-Dade County.
Buyers
- Ask for the listing contract date and available listing records; do not infer a portal's behavior from a day count.
- Counted days and asking prices do not establish what offer a seller will accept.
- Compare homes in the same current asking-price band, then review condition, fees and recent closed sales before making an offer.
Media writers
- Angle: 30% of active Miami Springs houses are recorded below original, compared with 40.8% in Miami-Dade County. This is a share comparison, not a measure of price-cut speed.
- Attribute page figures to PBP Real Estate analysis of BeachesMLS listing data, as of October 12, 2026. Use each download's own statistical date, figures and revision; refresh is scheduled daily.
More live Miami Springs data
PBP Real Estate analysis of BeachesMLS listings. Refresh is scheduled daily; read each index’s own date and sample.
Own a home or condo in Miami Springs? What is my home worth in Miami Springs? Current sale prices, houses and condos separate
For journalists: the Miami Springs numbers, ready to run
The English news kit offers headline options, a lede, a fact box, quotes, standalone charts and methodology. Use its own figures, statistical date and revision notice; it is not necessarily the same edition as this page. Current-kit refresh is scheduled daily. Free to reuse with attribution to PBP Real Estate analysis of BeachesMLS listing data. No form, no gate.
Headline options today
- 30% of Miami Springs houses for sale are asking less than their original list price. Small sample: 30 houses; read cautiously.
- Seller Blink Rate™ in Miami Springs: 30% of houses list below original asking, against 40.8% across Miami-Dade County. Small sample: 30 houses; read cautiously.
- Buying in Miami Springs? 9 of the 30 houses for sale are asking below their original price. Small sample: 30 houses; read cautiously.
Quotable
"30 percent of single-family homes for sale in Miami Springs have a current asking price below their original list price. Small sample: 30 houses; read cautiously."
Download
- Full press kit (zip, 1184 KB): PDF, plain text, three PNG charts, captions and alt text
- Journalist package (PDF)
- Plain text, paste-ready
- Seller Blink Rate™: 30% of Miami Springs houses for sale are asking below their original price, against 40.8% across Miami-Dade County. Small sample: 30 houses; read cautiously. (PNG)
- 27.6% of Miami Springs houses for sale with a recorded cumulative-days value exceed 90 days. Small sample: 30 houses; read cautiously. (PNG)
- Share asking below original by current asking-price band, Miami Springs houses. Small sample: 30 houses; read cautiously. (PNG)
Need a number or a licensed quote
Gia Freer, Broker of Record (Lic. BK689801) · 561-395-8418 · info@pbpre.com · same-day response Monday to Saturday. All city kits: pbprealestate.com/press.
What do people ask about Miami Springs price cuts?
What share of Miami Springs homes for sale have cut their price?
As of October 12, 2026, 30% of single-family homes for sale in Miami Springs (9 of 30) show an asking price below their original list price. 7 houses cut in the last 30 days. Condominiums: 3 for sale in Miami Springs, too few to report percentages (floor 30). Across Miami-Dade County the shares are 40.8% for houses and 37.7% for condominiums. Source: BeachesMLS, listings permitted for internet display.
How many homes were listed for sale in Miami Springs last week?
In the seven days ending October 12, 2026, 1 houses and 0 condominiums came on the market in Miami Springs. Of those 1 listings, 1 are first-time listings and 0 returned to the market after an earlier listing, because a listing is counted on the date it became active. Source: PBP Real Estate analysis of BeachesMLS listings permitted for internet display; houses and condominiums are counted separately.
How many Miami Springs sellers cut their asking price last week?
In the seven days ending October 12, 2026, 2 houses and 0 condominiums in Miami Springs recorded a reduction from their previous asking price. Over the last thirty days it was 7 houses and 2 condominiums. Source: PBP Real Estate analysis of BeachesMLS listings permitted for internet display.
Are there more homes for sale in Miami Springs this week than last week?
Miami Springs has 30 houses and 3 condominiums for sale as of October 12, 2026. PBP does not publish a week-over-week comparison yet: the first one is published on 16 September 2026 against the 9 September 2026 baseline, because PBP's coverage of the data widened on 9 September and an earlier comparison would measure the data rather than the market. Nothing here is estimated or backfilled.
How big is a typical price cut in Miami Springs?
Miami Springs houses: fewer than 10 below-original listings or median unavailable; no median reduction is interpreted.
How are days on market counted?
Miami Springs houses: median days on market counted by PBP 49 days; median counted cumulative days 49 days. Days on market are counted by PBP from the listing contract date recorded in the MLS to the snapshot date. For listings the MLS records as relisted, the recorded prior time on market is added to give cumulative days. The MLS's own day counters refresh in batches and can trail the calendar by weeks, so they are not used directly. Days spent under an earlier contract that fell through are not subtracted. Each median uses listings with a usable listing contract date. These figures do not independently reconstruct property histories or establish how portals display days on market.
How do under-contract asking prices compare with original prices?
Miami Springs: 4 houses listings under contract; fewer than 10 or percentage unavailable. No percentage or median is interpreted.
Are Miami Springs sellers cutting more or less than similar-priced cities right now?
By PBP's disclosed rule, Miami Springs houses: Between the comparison thresholds; 30% recorded below original versus 44.3% median across 28 peer cities; small sample: 30–39 active listings; 4 under contract, percentage not interpreted. Peer group: median asking $600K to $1M: Homestead, Royal Palm Beach, Coconut Creek, Hallandale Beach, Oakland Park, Pompano Beach, Hollywood, Dania Beach, Jensen Beach, North Miami Beach, Hialeah, Pembroke Pines, Miramar, Cutler Bay, West Palm Beach, North Miami, Westlake, Stuart, The Acreage, Coral Springs, Hobe Sound, Palm City, Cooper City, Plantation, Miami, Loxahatchee, Wilton Manors.
How the read works: the peer baseline is the median of published city shares in the same current median-asking-price tier, houses and condominiums separately. The lower-share label requires a below-original share at least 3 points under baseline and at least 65% of under-contract listings (minimum 10) not recorded as below original. That complement may include unchanged, raised or missing-price records; it is not a history measure. The higher-share label requires 3 or more points above baseline; other results are between the rule's thresholds. With fewer than four peer cities, the county is the baseline and can include the city. Samples of 30–39 active listings require caution. Snapshot comparison only, not speed, causality or a forecast.
How to cite this page
Free to reuse with attribution and a link to PBP Real Estate. Copy the line below; the URL is permanent and always shows the latest figures.
PBP Real Estate analysis of BeachesMLS listing data, "Miami Springs price cuts and days on market," as of October 12, 2026, https://www.pbprealestate.com/price-cuts-miami-springs/Method: Seller Blink Rate™ and recorded days. Every kit and chart: pbprealestate.com/press. Questions or a licensed quote: Gia Freer, Broker of Record (Lic. BK689801), 561-395-8418.
Seller Blink Rate™ is the share of active listings with a recorded asking price below the original list price. The denominator is all active listings in the segment. The complement may include unchanged prices, increases and missing-price records; it does not establish a price history. Days on market are counted by PBP from the listing contract date recorded in the MLS to the snapshot date. For listings the MLS records as relisted, the recorded prior time on market is added to give cumulative days. The MLS's own day counters refresh in batches and can trail the calendar by weeks, so they are not used directly. Days spent under an earlier contract that fell through are not subtracted. Each median uses listings with a usable listing contract date. These figures do not independently reconstruct property histories or establish how portals display days on market. Segments follow recorded tax legal description and MLS subtype. A legal description recording a condominium takes priority, including townhouse, villa or single-family forms. Condominium and Stock Cooperative subtypes remain condominiums when the legal is silent or describes a parent parcel, including new-build units. Remaining Townhouse and Villa listings are grouped in the HOA Fee Index; houses are remaining SingleFamilyResidence listings. These are analytical field classifications, not an independent determination of legal regime. “Miami Springs” groups the MLS City field within the five counties. It can span county lines and is not a municipal-boundary verification. The county comparison is calculated separately and can include this city's listings. Bands with 10–29 listings are qualified; fewer than 10 are not interpreted. A segment requires 30 active listings for percentages; 30–39 is a small sample. Source: BeachesMLS, listings permitted for internet display, via PBP Real Estate's brokerage feed. As of Oct 12, 2026. This data is not verified for authenticity or accuracy and may not reflect all real estate activity in the market. Based on information © 2026 BeachesMLS, Inc. Equal Housing Opportunity.

All listings featuring the BMLS logo are provided by BeachesMLS, Inc. This information is not verified for authenticity or accuracy and is not guaranteed. Copyright © 2026 BeachesMLS, Inc.
IDX information is provided exclusively for consumers' personal, non-commercial use, and may not be used for any purpose other than to identify prospective properties consumers may be interested in purchasing. Data is deemed reliable but is not guaranteed accurate by the MLS. Data last updated October 12, 2026.